
Business Performance Dashboard
Introduction
Small businesses need to make critical decisions every day to keep their businesses healthy and strong, but they often don’t have the financial expertise to make these decisions. Accounting professionals are in the best space to help push their business to the next level by giving advisory services. QuickBooks Online Accountant will help accounting professionals gain the tools they need to become more confident Advisors to their clients.
What is happening
Business Performance Dashboard will be released to all Accountant users in order to provide the best tools for accountants to provide advisory services. This new dashboard will be available when you click into the Overview Tab and select Business Health.
What does the Dashboard do
The purpose of the business performance dashboard is to allow accounting professionals to keep their client on track and using a more visual and consolidated view. There are currently two sections on the dashboard. We will continue to add function and make improvements as you get more feedback.
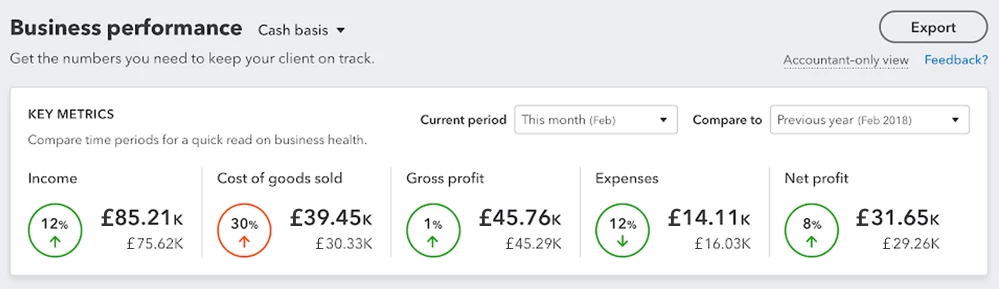
Key Metrics
The Key Metrics section lets you quickly get a glance on how your client is doing financially compared to a past time period. You can easily adjust the time period with the two drop downs provided. When a circle is green is means the numbers are looking better compared to the past period and when a circle is orange it indicates the number is not doing as well as the past period.
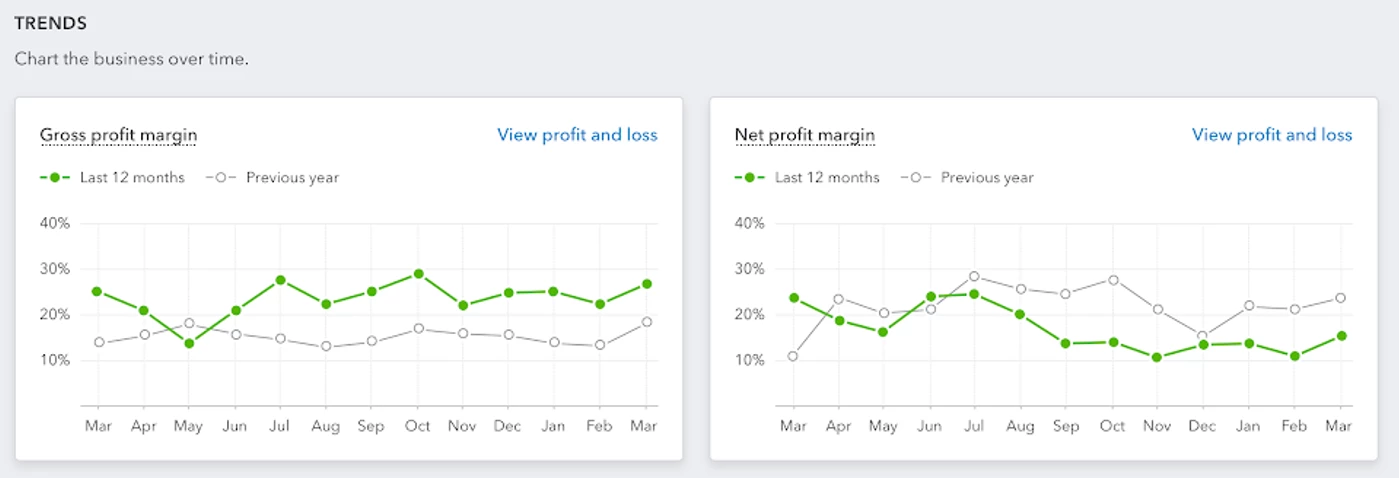
Trends
Trends allow you to see a holistic performance of your client in a visual view without having to pull the data together one by one. You can use the trends to compare this year versus last year as well as help you identify where your client should improve or need to dig deeper on.
Export
Coming soon - export information quickly to share with your clients. Add notes on your excel or pdf export.