August 16, 2023
Solved

Report for Average Monthly Item Sales (Units)

  • August 16, 2023
  • 1 reply
  • 0 views

Is it possible to generate a report that will give me the average units of each item sold over time?

I am interested in average monthly sales of each item.

Ex:

I select the timeframe of dates (January through August, 2023) and it shows:

                             monthly sales average

widget 1 (units)                        6

widget 2                                  20


Thank you!

Best answer by JaeAnnC

You've come to the right place for assistance, @DanBu. I'll be glad to guide you on how to generate a report showing the average monthly sales.


In QuickBooks Desktop (QBDT), we can run the Sales by Item Summary report to view the quantity of each product sold, the total amount and percentage of sales, and the average selling price. You can utilize this report to identify your best-selling items, track inventory levels, and analyze sales trends over time. To do that:


  1. Go to Reports.
  2. Click Sales and select Sales by Item Summary.
  3. In the Dates section, click Custom and set the period.
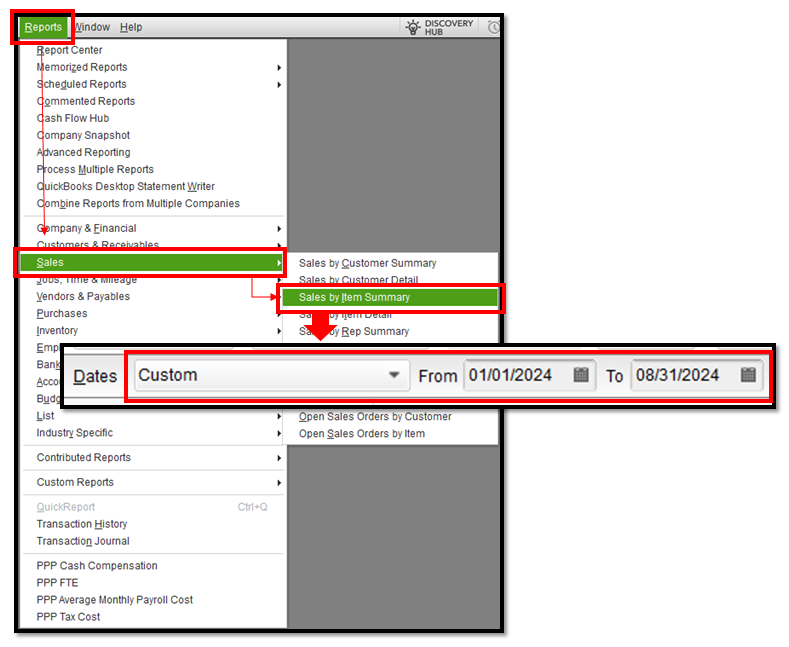
 

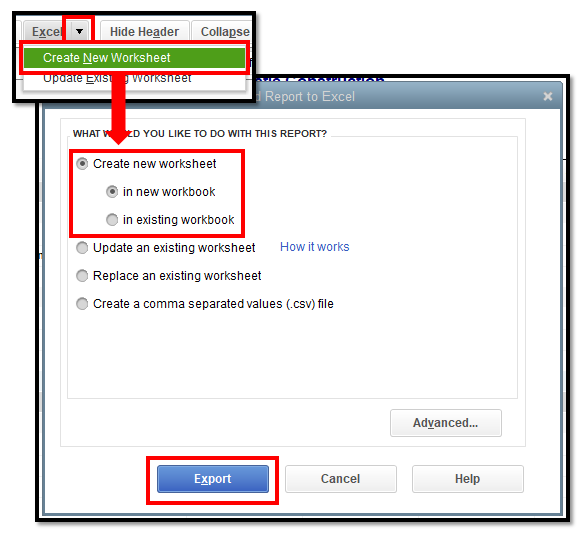
Currently, the report only displays the total sales within a specified period. To obtain the average, export it to Excel so you can manually calculate and enter it from there. Here's how:


  1. Click the Excel dropdown.
  2. Select Create New Worksheet.
  3. Click Create new worksheet, then Export.
 

Additionally, QBDT allows you to memorize reports to save their current customization settings and have them available for future use.


Please don't hesitate to drop by the Community whenever you need additional assistance with sales reports. The Community is here to help anytime. Stay safe and have a great rest of the day!


1 reply

JaeAnnC
JaeAnnCAnswer
August 16, 2023

You've come to the right place for assistance, @DanBu. I'll be glad to guide you on how to generate a report showing the average monthly sales.


In QuickBooks Desktop (QBDT), we can run the Sales by Item Summary report to view the quantity of each product sold, the total amount and percentage of sales, and the average selling price. You can utilize this report to identify your best-selling items, track inventory levels, and analyze sales trends over time. To do that:


  1. Go to Reports.
  2. Click Sales and select Sales by Item Summary.
  3. In the Dates section, click Custom and set the period.


Currently, the report only displays the total sales within a specified period. To obtain the average, export it to Excel so you can manually calculate and enter it from there. Here's how:


  1. Click the Excel dropdown.
  2. Select Create New Worksheet.
  3. Click Create new worksheet, then Export.


Additionally, QBDT allows you to memorize reports to save their current customization settings and have them available for future use.


Please don't hesitate to drop by the Community whenever you need additional assistance with sales reports. The Community is here to help anytime. Stay safe and have a great rest of the day!