

December 12, 2018
Solved

Sales Report Doesn't show Sub-Account sales

  • December 12, 2018
  • 1 reply
  • 0 views

When I run any "sales" report, it doesn't show any sales made and categorized as any sales sub-account. In other words, I created 5 sub-accounts to Sales (ie. Sales-Web Design, Sales-PPC Management, Sales-SEO management, etc.) but none of those sub-account sales show when I run a sales report.
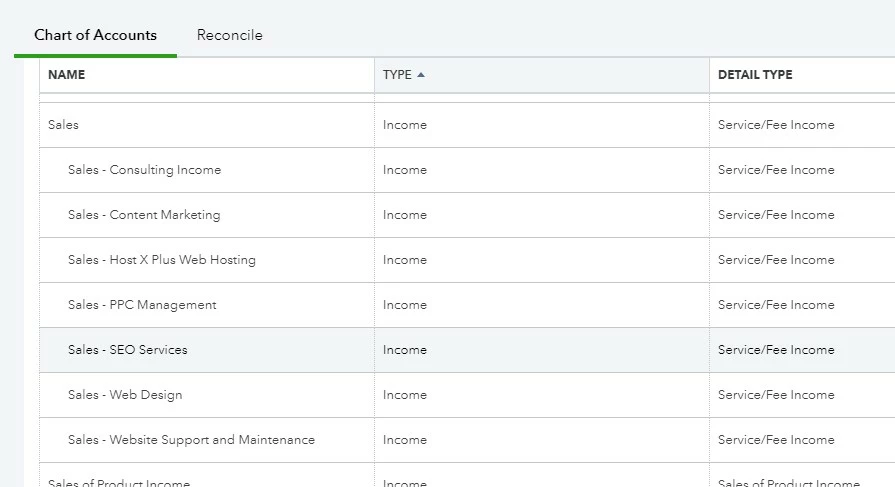
 

So my question is, how do I either (1) get them to show in the sales report? Or (2) create a custom sales report that includes sub-accounts?

Best answer by Malcolm Ziman

Thanks @AlcaeusF, that was actually my point. When I run that report, it's not showing all the sales!  It's only showing $35k.  Where are all the other sales I've made all year?


I'm guessing I just need to spend more time troubleshooting this myself. I'm sure there is some technical difference between what is showing as income and what is showing as "sales"....but in my mind, it's all the same. There is no difference. Even if it coming in through difference channels (QB invoice...PayPal...manual deposit)...shouldn't it all count as sales? Especially if I code it that way?


I don't believe sub-accounts is the problem.  You have to use either an Invoice (for sales on credit) or a Sales Receipt (for cash sales) if you want to see the income on the P&L, dashboard or in sales reports. If you create income with a Bank Deposit, then it will show in a P&L only,  but not on the dashboard or in sales reports

1 reply

December 12, 2018

Thank you for taking to time seek out our help, scottmckellam.


Let me help you run a report that will show your sales sub-accounts in QuickBooks Online (QBO).


If you wish to show sales sub-accounts, we can run Transaction Detail by Account and make sure to select All as your Filter for the Account. Please know that these sub-accounts will only show if there are transactions attached to it.


I'll show you how run the report by following the steps below:

  1. Go to Reports.
  2. Search for Transaction Detail by Account Report.
  3. Click Customize.
  4. Click Filter.
  5. From the Account, select All.
  6. Click Run report.

You can check out this article to learn more about customizing reports in QBO: How to customize reports.


There you have it. If I can assist you with anything else or about QuickBooks Sales reports, feel free to leave me a reply. Have a great day.

December 12, 2018

Thank you Charies! I appreciate you taking the time to respond. 


I suppose I could also run the "Income by Client Summary"...but it's a little offputting to see only $35k of the actual $64k of sales in the sales reports...or especially on the dashboard. 


I guess it's just sort of pointless to have the "Sales" graph in the Dashboard then...if it doesn't (or can't) include the Sales sub-accounts. 

AlcaeusF
December 12, 2018

Hi there, @scottmckellam.


I appreciate the screenshots that you've provided. I'm here to explain the difference between the amount that shows on the Dashboard's Sales graph and on the Income by Client Summary report.


The most likely reason why the amounts are different is that on the Income by Client Summary report all the transactions connected with an income account will show on the report. While the amount on the dashboard's sales graph is the total amount of all the transactions with an item that is being sold to your customers.


You may want to check the Sales by Customer detail report to match the dashboard sales graph. Here's how:


1. Go to Reports menu at the left panel.
2. Type Sales by Client Detail in the search bar.
3. On the Report period drop-down, select This Year-to-date.
4. Click Run report.


You can also take note of the article provided by my colleague @Charies_M to know more about customizing reports in QBO for future reference. 


That should answer your concern for today. Please let me know how it goes or if you're referring to something else by leaving a comment below. I'll be here to help. Take care always!